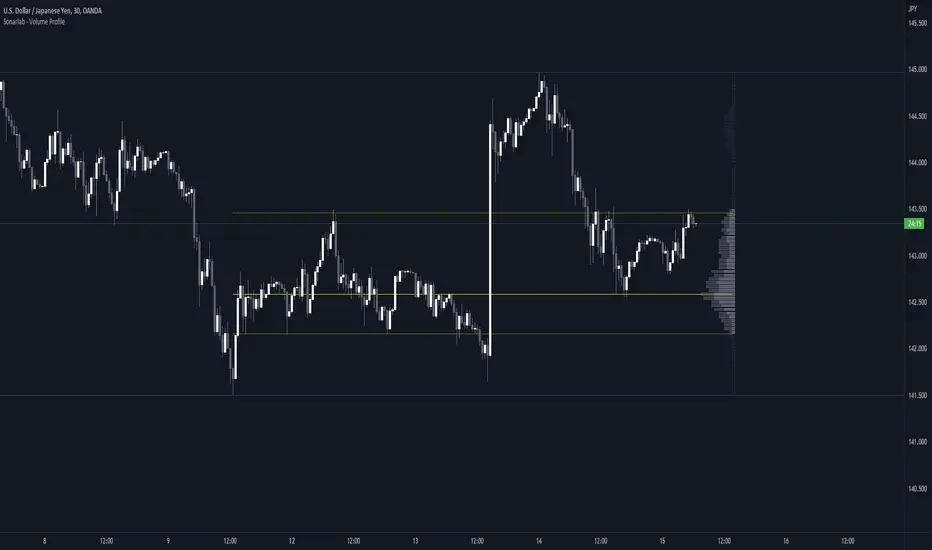
Sonarlab - Volume ProfileThis Volume Profile is a charting tool that traders use to show the traded volume amount over a given time period. The reason we build this volume profile indicator is to confirm S&D zones and show where the most volume is resting in a specific given time.
Settings
- Auto Placement: Option to have the Volume Profile automatically placed
- Manual Placement: Able to place and move the Volume Profile anywhere of your choosing
- Bull vs. Bear Candle Style
- Up/Down Candle Style
- Highlight Point of Control (PoC)
Usage:
Focused on combining with SMC:
When trading SMC, normal volume profiles can be confusing and hard to trade - since it will catch the volume on the overall chart you're on. When trading SMC, we are interested in catching specific parts in a range which defines supply or demand.
What makes this volume profile different?
The Sonarlab Volume Profile is focused on combining with SMC, integrated with Smart Money Concepts (SMC) levels, such as the Swing High and Low levels. The Indicator will automatically find the most applicable position using our custom Swing Levels to provide users with maximum utility with zero effort. Where other volume profiles are more focused on overall volume, this volume profile is focused on volume in a specific range on automation using swing points in the market.
As in this example, the high volume areas are matching with traditional supply and demand zones. The price level with the most volume is highlighted by the "point of control" (POC), displayed by the yellow line. We can consider price will react from those "high volume" areas and trade more easily through "low volume" areas.
在腳本中搜尋"volume profile"
Price Range Volume Profile++ [Pt]█ Introduction
The Price Range Volume Profile++ (PRVP++) is an advanced, feature-rich indicator specifically designed for volume profile users for in-depth volume analysis. Unlike most other volume profile tools that are limited to a 5000-bar lookback, PRVP++ can utilize all available candles on the chart, offering an unparalleled scope of historical data analysis.
█ Main Features
Full Chart Historical Lookback : PRVP++ sets a new standard with its ability to analyze the entire history of candles available on a chart, far exceeding the typical 5000-bar limit of other tools. This feature allows traders to conduct a comprehensive and detailed study of volume data over extensive time periods.
Volume Profile Analysis : The tool provides an in-depth volume profile analysis, showcasing the distribution of trading activity across different price levels. This is crucial for identifying key areas of interest in the market.
Bull/Bear Strength Profile : A standout feature that displays the relative strength of buyers (bulls) and sellers (bears) at different price levels. This visual representation helps traders gauge market sentiment and power dynamics.
Automatic HVN and LVN Identification : PRVP++ automatically highlights High Volume Nodes (HVNs) and Low Volume Nodes (LVNs), making it easier for traders to identify significant zones of trading activity and potential breakout areas.
Customization and Visual Enhancements : Offers customization for the profile's width, horizontal offset, and a sophisticated gradient color scheme for HVNs and LVNs, enhancing the tool's visual appeal and analytical utility.
█ Input Parameters
Price Range : Sets the percentage distance for the volume profile relative to the current closing price, determining the extent of volume data analysis.
Profile Step Size (Tick Size) : Users can choose automatic sizing or set a specific tick step size, offering flexibility in the granularity of the volume profile.
Volume Profile Options : Includes settings for gradient power and color selections for high and low volume areas, along with a fun mode for random color variations.
Profile Placement and Appearance : Adjustments for profile width, horizontal offset, and the option for background fill to enhance visibility.
Background Fill : Allows users to fill the background of the volume profile range, enhancing the visual impact and readability.
Time Weighted Profile : An option that weights the volume profile to give more emphasis to recent trading activities, highlighting the impact of recent market movements.
Smooth Filter : A feature that smoothens the volume profile to reduce noise and fluctuations, offering a clearer view of dominant volume levels.
High and Low Volume Node Settings : Customizable detection settings for HVNs and LVNs, line styles, label text sizes, and the option to extend lines for clearer market analysis.
Extra Settings : Includes displaying the current price on the profile, a customizable settings table with adjustable location and font size, and table opacity.
Random Color Generation : A feature for dynamically changing the colors used in the volume profile.
█ Possible Use Cases
Long-Term Market Analysis : Due to its ability to analyze all available candles on the chart, PRVP++ is exceptionally suited for long-term market analysis. Traders can study the historical volume profile over extended periods, identifying significant volume trends and shifts that could impact long-term investment strategies.
Identifying Key Support and Resistance Levels : The automatic HVN and LVN identification feature of PRVP++ makes it easier for traders to spot potential support and resistance levels. HVNs often correspond to strong support or resistance zones where significant trading activity has occurred, while LVNs may indicate levels where the price could break through more easily.
Gauging Market Sentiment with Bull/Bear Strength Profile : The Bull/Bear Strength Profile helps traders understand the prevailing market sentiment at different price levels. By analyzing the dominance of buying or selling pressure, traders can align their trades with the market's direction or prepare for potential reversals.
Intraday Trading and Scalping : For intraday traders and scalpers, the time-weighted feature and the ability to adjust profile step size offer valuable insights. By emphasizing recent trading activity and adjusting the granularity of the profile, traders can make more informed decisions based on short-term price movements and volume changes.
Breakout Trading : By utilizing the LVN identification, traders can pinpoint areas with low trading activity that might serve as potential breakout points. This information can be instrumental in formulating strategies to capitalize on sudden price movements.
Volume Gap Analysis : PRVP++ can be used to identify volume gaps, which are areas with significantly low volume. These gaps can act as important indicators for price movements, as prices may move quickly through these levels due to the lack of historical trading activity.
Risk Management and Position Sizing : Understanding the volume profile can aid in better risk management and position sizing. By recognizing areas of high and low volume, traders can set stop-loss orders more effectively and adjust their position sizes according to the perceived strength of support or resistance levels.
Swing Trading : For swing traders, the comprehensive historical lookback and HVN/LVN analysis provide critical information about where to enter and exit trades. Swing traders can utilize these features to identify trend reversals and momentum shifts.
█ Best Practices and Tips
Start with a Clear Understanding : Before utilizing PRVP++, ensure you have a solid grasp of volume profile concepts. Understanding High Volume Nodes (HVNs), Low Volume Nodes (LVNs), and their implications on market behavior is crucial.
Combine with Other Analysis Tools : While PRVP++ is powerful, it's most effective when used in conjunction with other technical analysis tools and indicators. Combining volume profile data with price action analysis, trend lines, and technical indicators can provide a more comprehensive market view.
Customize According to Your Trading Style : Tailor the tool's settings to fit your trading strategy. Day traders might prefer a more detailed profile, while long-term investors may benefit from broader data analysis.
Pay Attention to HVNs and LVNs : HVNs can indicate potential support or resistance areas, while LVNs might suggest breakout points. Monitor these areas closely for trading opportunities.
Utilize the Full Historical Lookback Feature : For a broader perspective, use the full historical lookback feature to understand long-term volume patterns and their impact on current price movements.
Keep an Eye on Bull/Bear Strength : Use the Bull/Bear Strength Profile to gauge market sentiment at different price levels. This can help in predicting potential price movements.
Regularly Update Your Strategy : As market conditions change, regularly review and adjust your use of PRVP++ to ensure it aligns with current market dynamics.
Stay Informed About Market News : Be aware of how economic news and global events might affect the volume and price, as these factors can significantly impact the effectiveness of volume-based strategies.
█ Disclaimers and Risk Advice
No Guarantee of Profits : Trading involves risk, and the use of the PRVP++ tool does not guarantee profits. Always be aware of the potential for loss.
Educational Purposes Only : The information provided by PRVP++ is for educational purposes only and should not be considered financial advice.
Not a Standalone Tool : PRVP++ should not be used as a standalone decision-making tool. Combine it with comprehensive market analysis and personal judgment.
Past Performance Not Indicative of Future Results [/b: Historical data and trends analyzed by PRVP++ do not guarantee future market behavior.
Use Risk Management : Always employ sound risk management strategies, including setting stop-loss orders and managing position sizes to protect your capital.
Personal Responsibility : Trading decisions remain the responsibility of the individual trader. Use PRVP++ as one of several tools in your decision-making process.

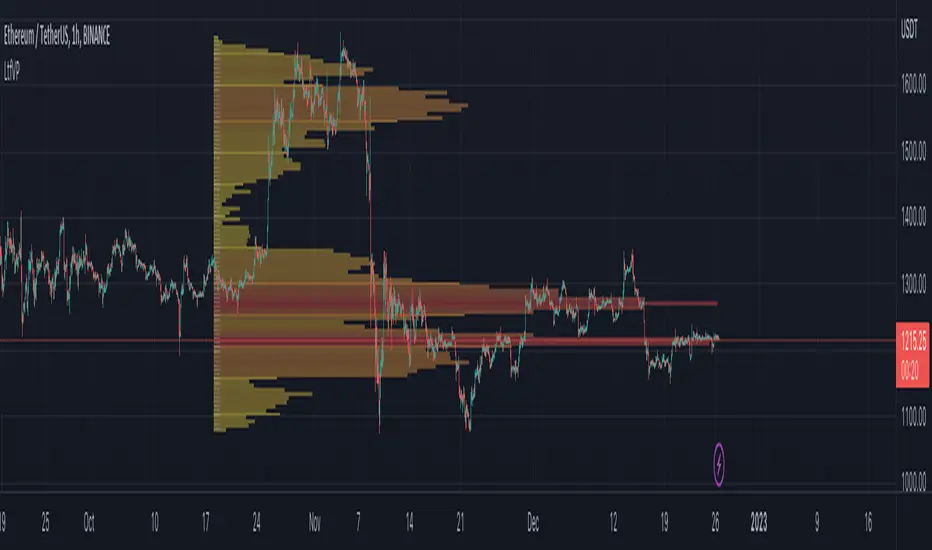
Price Range Volume Profile [Pt]█ Introduction
The Price Range Volume Profile (PRVP) is a revolutionary indicator. This tool stands out from its peers due to its unique ability to capture the entire price chart history, thus providing a comprehensive volume profile of the entire asset's trading history, as available on TradingView chart. It's worth noting that I believe this tool is the first of its kind to accomplish such a feat. A much recommended tool if you are a volume profile trader.
█ Main Features
► Historical Lookback: This feature dives deep into the past, grasping all the historical data of an asset. It's equipped to handle up to 20,000 bars, although users without a premium TradingView account are advised to keep it at a maximum of 10,000 bars, or just use the "Full Historical Lookback" feature.
► Volume Profile / POC: Displays the distribution of volume across price levels for the selected price range. The Point of Control (POC), which is the price level with the highest traded volume, is also highlighted.
► Customization: Users have the flexibility to adjust the profile's appearance, including profile width, horizontal offset, and the option to fill the background of the profile range.
► Time Weighting: This feature allows users to give more weight to recent trading activity, which can be especially useful for intraday traders or during times of high volatility. Note that this feature will impact the volume profile and POC level.
► Settings Table: A settings table is displayed on the chart for users to quickly reference their input parameters.
█ Input Parameters
► Lookback Timeframe: Determines the period for which the volume profile is generated.
► Price Range: The percentage distance to consider for the profile, adjusted above and below the current closing price.
► Profile Step size: The granularity of the volume profile. Users can opt for automatic step size based on a predefined calculation or set their preferred tick step size.
► Historical Bars Lookback: Determines the number of bars to include in the volume profile calculation.
► Profile Visuals: Adjust the appearance and layout of the volume profile on the chart.
► Extra: Additional settings including the display of a settings table and its location.
█ Basic Understanding of Volume Profile - How to use PRVP?
Volume Profile is a valuable tool for traders who want insights into where the majority of trading activity has occurred. Here are some tips to make the most of it:
► Understand the Basics: Before using the Volume Profile, ensure you understand the difference between it and the standard volume histogram. While both represent volume, the former displays it against price while the latter shows it against time.
► Identify High Volume Nodes (HVN) and Low Volume Nodes (LVN):
◊ HVN: Areas where there's a lot of trading activity and where the price has spent a lot of time. These areas can act as strong support or resistance.
◊ LVN: Areas where there's a lack of trading activity. Prices might move quickly through these areas, and they can act as potential breakpoints or accelerators for price movement.
► Locate the Point of Control (POC): This is the price level with the highest traded volume for a specified period. It often acts as a magnet for price, and it can serve as a pivot or reference point.
► Trend Confirmation: A shift in the volume profile from one price level to another can confirm a trend. For instance, if higher volume starts to build at higher price levels, it may indicate a strong uptrend.
► Watch for Volume Gaps: If there's a significant gap in the volume profile, prices may move quickly through these levels as there's little historical trading activity to act as support or resistance.
█ Other Usage Tips
◊ For optimal performance, ensure that the chosen timeframe aligns closely with the chart timeframe. Differences in timeframes may lead to minor discrepancies in the volume profile.
◊ To address any errors arising from too many levels displayed on the volume profile, consider increasing the Profile Step size or reducing the Price Range.

Interactive Volume Profile - Based on LTF volumeHere is my first attempt on defining volume profile. In this script, I am using new feature of pine security_lower_tf
Upon loading the script, it will ask users to select Time range to show the volume profile. Once you select the time range, confirmation input will popup. Upon confirming the inputs, you will be able to view the volume profile
Settings are pretty simple. Some of them appear as part of confirmation.
Limitation due to availability of LTF bars
security_lower_tf can only fetch upto 100k bars, Hence, if we move the starting point beyond that, we will only see volume profile from the bar where LTF volume data is available. Increasing lower timeframe resolution will also increase the available range of volume profile. Option also available to use max range instead of time based range. If max bar range is selected, then volume profile is drawn based on all the bars for which LTF volume is available.
An example of all combinations are show below.
Selecting the granularity of volume profile
Number of levels can be set from settings which impacts the granularity of volume profile. Below is the example of how different values for number of levels behave.
Institutional Volume Profile# Institutional Volume Profile (IVP) - Advanced Volume Analysis Indicator
## Overview
The Institutional Volume Profile (IVP) is a sophisticated technical analysis tool that combines traditional volume profile analysis with institutional volume detection algorithms. This indicator helps traders identify key price levels where significant institutional activity has occurred, providing insights into market structure and potential support/resistance zones.
## Key Features
### 🎯 Volume Profile Analysis
- **Point of Control (POC)**: Identifies the price level with the highest volume activity
- **Value Area**: Highlights the price range containing a specified percentage (default 70%) of total volume
- **Multi-Row Distribution**: Displays volume distribution across 10-50 price levels for detailed analysis
- **Customizable Period**: Analyze volume profiles over 10-500 bars
### 🏛️ Institutional Volume Detection
- **Pocket Pivot Volume (PPV)**: Detects bullish institutional buying when up-volume exceeds recent down-volume peaks
- **Pivot Negative Volume (PNV)**: Identifies bearish institutional selling when down-volume exceeds recent up-volume peaks
- **Accumulation Detection**: Spots potential accumulation phases with high volume and narrow price ranges
- **Distribution Analysis**: Identifies distribution patterns with high volume but minimal price movement
### 🎨 Visual Customization Options
- **Multiple Color Schemes**: Heat Map, Institutional, Monochrome, and Rainbow themes
- **Bar Styles**: Solid, Gradient, Outlined, and 3D Effect rendering
- **Volume Intensity Display**: Visual intensity based on volume magnitude
- **Flexible Positioning**: Left or right side profile placement
- **Current Price Highlighting**: Real-time price level indication
### 📊 Advanced Visual Features
- **Volume Labels**: Display volume amounts at key price levels
- **Gradient Effects**: Multi-step gradient rendering for enhanced visibility
- **3D Styling**: Shadow effects for professional appearance
- **Opacity Control**: Adjustable transparency (10-100%)
- **Border Customization**: Configurable border width and styling
## How It Works
### Volume Distribution Algorithm
The indicator analyzes each bar within the specified period and distributes its volume proportionally across the price levels it touches. This creates an accurate representation of where trading activity has been concentrated.
### Institutional Detection Logic
- **PPV Trigger**: Current up-bar volume > highest down-volume in lookback period + above volume MA
- **PNV Trigger**: Current down-bar volume > highest up-volume in lookback period + above volume MA
- **Accumulation**: High volume + narrow range + bullish close
- **Distribution**: Very high volume + minimal price movement
### Value Area Calculation
Starting from the POC, the algorithm expands both upward and downward, adding volume until reaching the specified percentage of total volume (default 70%).
## Configuration Parameters
### Profile Settings
- **Profile Period**: 10-500 bars (default: 50)
- **Number of Rows**: 10-50 levels (default: 24)
- **Profile Width**: 10-100% of screen (default: 30%)
- **Value Area %**: 50-90% (default: 70%)
### Institutional Analysis
- **PPV Lookback Days**: 5-20 periods (default: 10)
- **Volume MA Length**: 10-200 periods (default: 50)
- **Institutional Threshold**: 1.0-2.0x multiplier (default: 1.2)
### Visual Controls
- **Bar Style**: Solid, Gradient, Outlined, 3D Effect
- **Color Scheme**: Heat Map, Institutional, Monochrome, Rainbow
- **Profile Position**: Left or Right side
- **Opacity**: 10-100%
- **Show Labels**: Volume amount display toggle
## Interpretation Guide
### Volume Profile Elements
- **Thick Horizontal Bars**: High volume nodes (strong support/resistance)
- **Thin Horizontal Bars**: Low volume nodes (weak levels)
- **White Line (POC)**: Strongest support/resistance level
- **Blue Highlighted Area**: Value Area (fair value zone)
### Institutional Signals
- **Blue Triangles (PPV)**: Bullish institutional buying detected
- **Orange Triangles (PNV)**: Bearish institutional selling detected
- **Color-Coded Bars**: Different colors indicate institutional activity types
### Color Scheme Meanings
- **Heat Map**: Red (high volume) → Orange → Yellow → Gray (low volume)
- **Institutional**: Blue (PPV), Orange (PNV), Aqua (Accumulation), Yellow (Distribution)
- **Monochrome**: Grayscale intensity based on volume
- **Rainbow**: Color-coded by price level position
## Trading Applications
### Support and Resistance
- POC acts as dynamic support/resistance
- High volume nodes indicate strong price levels
- Low volume areas suggest potential breakout zones
### Institutional Activity
- PPV above Value Area: Strong bullish signal
- PNV below Value Area: Strong bearish signal
- Accumulation patterns: Potential upward breakouts
- Distribution patterns: Potential downward pressure
### Market Structure Analysis
- Value Area defines fair value range
- Profile shape indicates market sentiment
- Volume gaps suggest potential price targets
## Alert Conditions
- PPV Detection at current price level
- PNV Detection at current price level
- PPV above Value Area (strong bullish)
- PNV below Value Area (strong bearish)
## Best Practices
1. Use multiple timeframes for confirmation
2. Combine with price action analysis
3. Pay attention to volume context (above/below average)
4. Monitor institutional signals near key levels
5. Consider overall market conditions
## Technical Notes
- Maximum 500 boxes and 100 labels for optimal performance
- Real-time calculations update on each bar close
- Historical analysis uses complete bar data
- Compatible with all TradingView chart types and timeframes
---
*This indicator is designed for educational and informational purposes. Always combine with other analysis methods and risk management strategies.*

Footprint Chart + Volume ProfileFootprint charts provide volume information to candlestick charts. This indicator specifically provides the quantity of Market Orders executed on each side of the Order Book, thereby showing you the number of contracts that had hit the bid or the offer - and it does so on each bar.
In addition, it visualises a Volume Profile for each bar, providing you an even better visualisation, contrasted to that which renders the numbers alone.
This Footprint Chart calculates executed orders by getting the change in volume for every price move and pooling them on their corresponding "tick bucket". Their specific "tick bucket" is calculated on the nearest "tick", the size of which you will provide by setting the "Tick Size/ Increment" to whichever tick size you need .
For instance, volume changes on a price of 10.4 on a 1 tick Footprint Chart will be recorded as part of the nearest whole number(10), while on a 3 tick Footprint Chart, it will be recorded as part of 9 as it is the nearest multiple of 3.
Calculating the "tick bucket" this way is most conservative, however, if you would like it calculated differently — Having the volume changes recorded on the succeeding tick, e.g. Recording 10.4 as 12 on a 3 tick Footprint Chart. Simply set the "Tick Basket Assignment" to "Next Tick", While setting the same to "Previous Tick" records volume changes on the preceding tick. Default is "Nearest Tick".
How to read the Footprint Chart?
This Footprint Chart depicts a portion of the Depth of Market, arranged in such a way that the left side represents the bid, while the right side represents the ask. It is therefore natural that orders hitting the bid (Market Sells) are to be placed on the Left Side of the chart while orders hitting the ask (Market Buys) are to be placed on the Right Side. This way, you can visualise how the current price came to be, as well as observe with the several order flow analysis concepts and ideas you can apply. In summary, numbers on the Left represents Sell Orders and numbers on the Right represents Buy Orders.
If, however, you wish to see only the total volume that transacted within the bar, you may do so by toggling the "Split Buy and Sell" option.
Footprint Chart showing only the total volume:
Furthermore, this chart has its own candles, the width of which can be adjusted accordingly.
Volume Profile
This Footprint Chart offers a Stacked Volume Profile and an Unstacked Volume Profile, the former renders a Volume Profile which compares the buys from the sells, the better to visualise levels of activity, the latter renders a standard Volume Profile which shows the total volume that transacted on a price tick.
The type of Volume Profile that this Footprint Chart renders is similar to that of a Periodic Volume Profile, which renders Volume Profiles for every bar on the chart. Furthermore, the width of each Volume Profile bar of this Footprint Chart is relative to the largest volume transacted on the current session, the session beginning from the point you have opened the Footprint Chart until the 500th bar, capped for optimisational purposes, and shall adjust the session start accordingly once this limit had been reached. The Volume Profile bars' width will therefore change agreeably to each significant volume update, and sized relatively with that of the others.
Optimisation
This Footprint Chart utilises several drawings and calculations for attaining its visuals, the arrangement of which makes it more pleasing and easier to understand. Several optimisations have been implemented within the code, e.g. utilising queues, however, if you wish for it to be even more optimised, you can use an "Unstacked" Volume Profile, using larger tick sizes, as well as using 0 decimal placements for the Footprint Chart.
Furthermore, deselecting "Use Stacked Bars" will allow more boxes to be drawn, and will double the amount of boxes the volume profile can use.
Limitations
No historical tick data have yet been made available for use and so this Footprint Chart only has realtime data at its disposal. Historical footprints are therefore not rendered, the boundary of which is delineated by a vertical broken line.
Tips
This Footprint Chart is best viewed on a chart of its own, and it is therefore ideal to clear the chart of other candles by hiding them or utilising a line chart alternatively . In addition, stretch the time scale to its utmost capacity, the better to see properly the Volume Profile, as well as stretch the price scale to a proper height, the better to read the footprint volumes inscribed on the indicator.
Warnings
Changing settings may cause the Footprint Chart to reset. If, in case you have been accumulating Footprint Charts and wish to change some settings for the benefit of your charting, it is best to take a snapshot of your chart prior, for recent changes may cause resets to occur.

Frequency and Volume ProfileFREQUENCY & VOLUME PROFILE
⚪ OVERVIEW
The Frequency and Volume Profile indicator plots a frequency or volume profile based on the visible bars on the chart, providing insights into price levels with significant trading activity.
⚪ USAGE
● Market Structure Analysis:
Identify key price levels where significant trading activity occurred, which can act as support and resistance zones.
● Volume Analysis:
Use the volume mode to understand where the highest trading volumes have occurred, helping to confirm strong price levels.
● Trend Confirmation:
Analyze the distribution of trading activity to confirm or refute trends, mark important levels as support and resistance, aiding in making more informed trading decisions.
● Frequency Distribution:
In statistics, a frequency distribution is a list of the values that a variable takes in a sample. It is usually a list. Displayed as a histogram.
⚪ SETTINGS
Source: Select the price data to use for the profile calculation (default: hl2).
Move Profile: Set the number of bars to offset the profile from the current bar (default: 100).
Mode: Choose between "Frequency" and "Volume" for the profile calculation.
Profile Color: Customize the color of the profile lines.
Lookback Period: Uses 5000 bars for daily and higher timeframes, otherwise 10000 bars.
The Frequency Profile indicator is a powerful tool for visualizing price levels with significant trading activity, whether in terms of frequency or volume. Its dynamic calculation and customizable settings make it a versatile addition to any trading strategy.

Average Volume ProfileAverage Volume Profile is an abstract based on a user suggestion.
The information displayed could be summed up as a volume profile divided by a market profile.
This indicator is a profile which displays the average volume of an area (of price).
It also calculates and displays the highest average volume point (HAV) and the relating value zones (calculated in the similar fashion to a volume profile).
Most of the code is directly from my "Volume/Market Profile" Indicator
I am not entirely sure of how to make use of the information displayed in this indicator or how useful it is.
However, I have added some things I figured would be useful to comprehend this information, such as:
- Read-out for highest average volume
- Read-out for current price average volume
- Read-out for current candle distributed volume (labeled as: "Vol")
- Floating line to visualize the current distributed volume in relation to the rest of the profile.
- Color changing labels for when the current distributed volume is higher than the current price avg volume.
Enjoy!

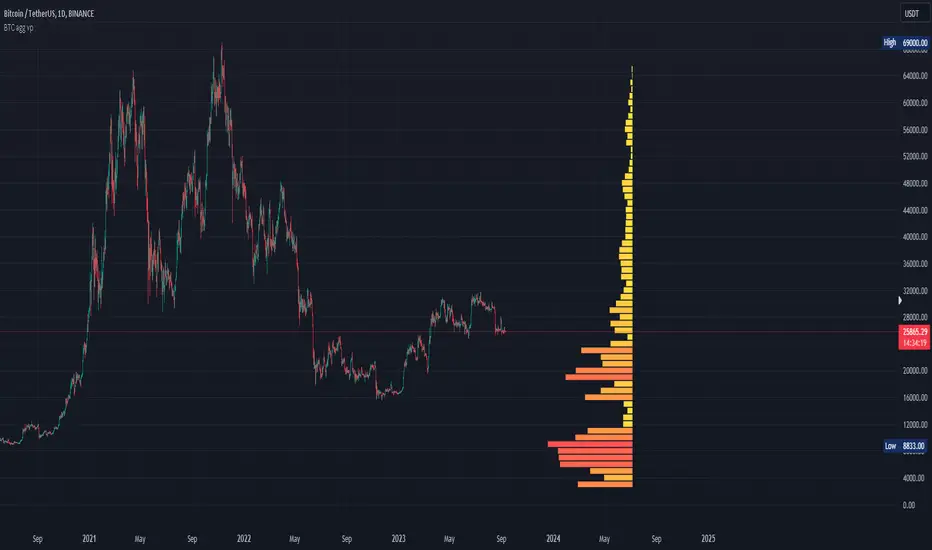
Bitcoin Aggregated Volume Profile «NoaTrader»If you use volume profile for analyzing Bitcoin, you may know that sometimes the decisions of big CEXs like Binance can change the volume of each symbol and so the analysis perceived from the data (which may not be valid anymore); Like when Binance decided to transfer the free transaction fee promotion from BTCUSDT to BTCTUSD pair or the new introduced BTCFDUSD pair with volume market share as much as BTCTUSD after only 1 month (according to the coinmarketcap's data).
This indicator tries to solve that problem for using volume profile. So, it collects all the volumes of different pairs from different exchanges and then uses all of them to calculate the volume profile.
Also, there is an option to compare the current symbols volume to the whole volume profile which is a Boolean option in the settings (the picture above)
The aggregated volume data includes:
BINANCE:BTCUSDT
BINANCE:BTCTUSD
BINANCE:BTCBUSD
BINANCE:BTCFDUSD
BINANCE:BTCDAI
BINANCE:BTCEUR
BITSTAMP:BTCUSDT
BITSTAMP:BTCUSD
COINBASE:BTCUSDT
COINBASE:BTCUSD
COINBASE:BTCEUR
HUOBI:BTCUSDT
KUCOIN:BTCUSDT
KRAKEN:XBTUSD
KRAKEN:XBTEUR
BITFINEX:BTCUSD
BYBIT:BTCUSDT
KRAKEN:BTCUSD
OKX:BTCUSDT
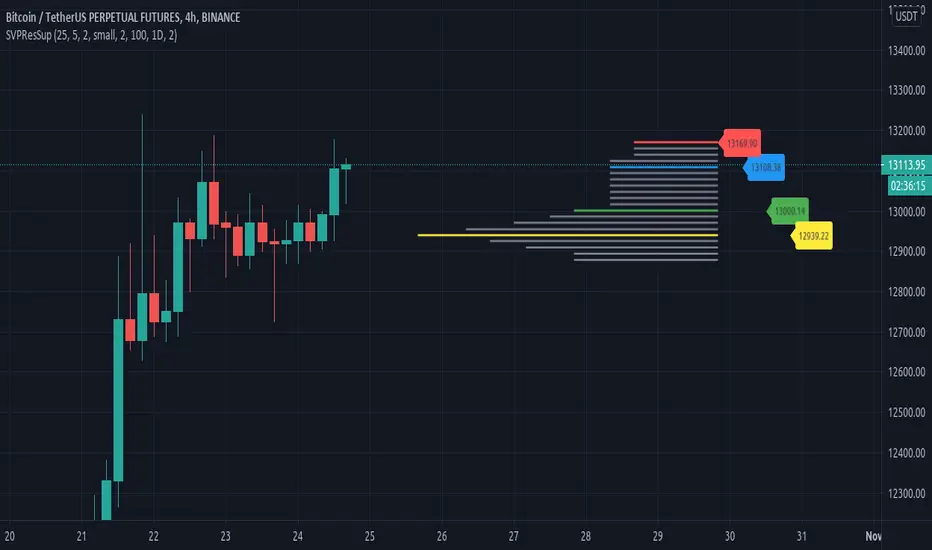
Resistances and supports based on simplified Volume ProfileThis study tries to highlight support and resistances
as they are defined by
TradingLatino TradingView user
His definition is based on volume peaks
on the official TradingView Volume Profile
indicator that seem rather big on size.
As a bonus it also serves as a rather simple volume profile indicator.
As you can see it only show last blocks volume profile.
It's aimed at BTCUSDT pair and 4h timeframe.
HOW IT WORKS
HOW IT WORKS - Recent Profile Block
It gathers volume from the last 100 Bars
in order to draw the recent profile block
Volume that intersects with current level range
being studied is added to its value.
Additionally the current level price is modified
so that it matches the level price where most
of the volume has concentrated
So you get a pretty accurate way of the volume
while at the same time the level are not stuck
to arbitrary level prices.
HOW IT WORKS - Resistances and Supports
It calculates the level which its price it's
nearer (from below) to the current price level
Resistance is found steping up (from current prive level)
level by level
till you find a level which its value
is higher than the previous level value.
Support is found steping down (from current prive level)
level by level
till you find a level which its value
is higher than the previous level value.
That way you ignore rather small
resistances and support values.
Finally the resistances and supports are drawn next to the recent profile block
so that you can look at them with ease.
If you hover over the label you can double check if you are looking at
current price, resistance or support levels.
SETTINGS
Bars in recent profile block : How many previous period volumes are used to calculate the recent profile block
Row width multiplier : Adjust how big the recent profile block seems to be
Resistances prices number of decimal digits : How many digits is shown at the resistance and support level prices.
WARNING
Please be aware that depending on your security and timeframe you might need to modify the
'Bars in recent profile block' setting so that the study does not timeout.
USAGE
If your strategy calculates take profit
limits on higher resistances based
on volume you could use this indicator
resistance detector
FEEDBACK 1
This is my first volume indicator.
I suppose that each trader
has his own approach on defining
resistances and supports.
I'm interested on knowing if the default way
this resistances and supports are calculated
matches what other traders would have
highlighted manually on the chart.
FEEDBACK 2
I have only used this identifier in BTCUSDT 4h timeframe.
I'm interested to know what needs to be tweaked
in other securities and timeframes.
PINE STUDY TRICK
This study let's you choose the number of decimals the label will use.
CREDITS
I have reused and adapted some code from
'Poor man's volume profile' study
which it's from TradingView IldarAkhmetgaleev user.
I also wanted to thank him for helping me understanding his study.
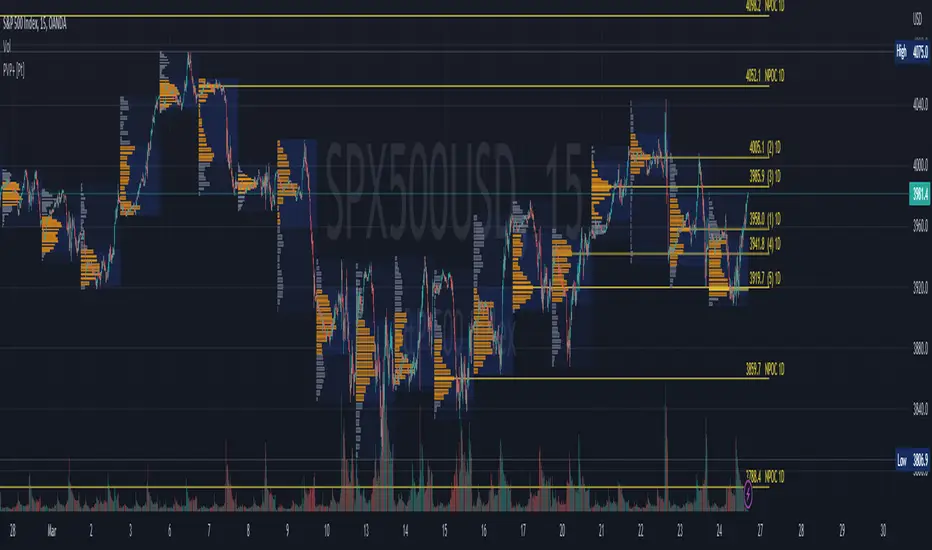
Price & Volume Profile (Expo)█ Overview
The Price & Volume Profile provides a holistic perspective on market dynamics by simultaneously tracking price action and trading volume across a range of price levels. So it is not only a volume-based indicator but also a price-based one. In addition to illustrating volume distribution, it quantifies how frequently the price has fallen within a particular range, thus offering a holistic perspective on market dynamics.
This unique and comprehensive approach to market analysis by considering both price action and trading volume, two crucial dimensions of market activity. Its distinctive methodology offers several advantages:
Holistic Market View: By simultaneously tracking the frequency of specific price ranges (Price Profile) and the volume traded at those ranges (Volume Profile), this indicator provides a more complete picture of market behavior. It shows not only where the market is trading but also how much it's trading, reflecting both price acceptance levels and market participation intensity.
Point of Control (POC): The POC, as highlighted by this indicator, serves as a significant reference point for traders. It identifies the price level with the highest trading activity, thus indicating a strong consensus among market participants about the asset's fair value. Observing how price interacts with the POC can offer valuable insights into market sentiment and potential trend reversals.
Support and Resistance Levels: Price levels with high trading activity often act as support or resistance in future price movements. The indicator visually represents these levels, enabling traders to anticipate potential price reactions.
Price Profile
Price and Volume Profile
█ Calculations
The algorithm analyzes both trade frequency and volume across different price levels. It identifies these levels within the visible chart range, then examines each bar to determine if the selected price falls within these levels. If so, it increases a counter and adds the trading volume. This process repeats across the visible range and is visualized as a horizontal histogram, each bar representing a price level and the bar length reflecting trade frequency and volume. Additionally, it calculates the Point of Control (POC), signifying the price level with the highest activity.
In summary: The histogram presents a dual perspective - not only the traded volume at each price level but also the frequency of the price hitting each range. The longer the bar, the more times the price has frequented that specific range, revealing key insights into price behavior and acceptance levels. These frequently visited areas often emerge as strong support or resistance zones, helping traders navigate market movements.
Please note that the indicator adjusts to the visible price range, making it adaptable to changing market conditions. This dynamic analysis can provide more relevant and timely information than static indicators.
█ How to use
This indicator is beneficial for traders as it offers insights into the distribution of trading activity across different price levels. It helps identify key areas of support and resistance and gives a visual representation of market sentiment and liquidity.
The point of control (POC) , which is the price level with the highest traded volume or frequency count, becomes even more crucial in this context. It marks the price at which the most trading activity occurred, signaling a strong consensus among market participants about the asset's fair value. If the market price deviates significantly from the POC, it could suggest an overbought or oversold condition, potentially leading to a price reversion.
Fair Price Areas/gaps are specific price levels or zones where an asset has spent limited time in the past. These areas are considered interesting or significant because they may have an impact on future price action.
Similar to the concept of fair value gaps, which refers to discrepancies between an asset's market price and its estimated intrinsic value, Fair Price Areas/gaps focus on price levels that have been relatively underutilized in terms of trading activity. When an asset's price reaches a Fair Price Area/gap, traders and investors pay attention because they expect the price to react in some way. The rationale behind this concept is that price tends to gravitate towards areas where it has spent less time in the past, as the market perceives them as significant levels.
█ Settings
The indicator is customizable, allowing users to define the number of price levels (rows), the offset, the data source, and whether to display volume or frequency count. It also adjusts dynamically to the visible price range on the chart, ensuring that the analysis remains relevant and timely with changing market conditions.
Source: The price to use for the calculation. Typically, this is the closing price. By considering the user-selected Source (typically the closing price), the indicator determines the frequency with which the price lands within each designated price level (row) over the selected period. In essence, the indicator provides a count of bars where the Source price falls within each range, essentially creating a "Price Profile."
Row Size: The number of price levels (rows) to divide the visible price range into.
Display: Choose whether to display the number of bars ("Counter") or the total volume ("Volume") for each price level.
Offset: The distance of the histogram from the price chart.
Point of Control (POC): If enabled, the indicator will highlight the price level with the most activity.
-----------------
Disclaimer
The information contained in my Scripts/Indicators/Ideas/Algos/Systems does not constitute financial advice or a solicitation to buy or sell any securities of any type. I will not accept liability for any loss or damage, including without limitation any loss of profit, which may arise directly or indirectly from the use of or reliance on such information.
All investments involve risk, and the past performance of a security, industry, sector, market, financial product, trading strategy, backtest, or individual's trading does not guarantee future results or returns. Investors are fully responsible for any investment decisions they make. Such decisions should be based solely on an evaluation of their financial circumstances, investment objectives, risk tolerance, and liquidity needs.
My Scripts/Indicators/Ideas/Algos/Systems are only for educational purposes!

Silen's Pseudo VPVR / Pseudo Volume Profile Custom RangeDisclamer: This indicator does not use actual Volume data and doesn't display any Volume data. It creates a pseudo Volume Profile by counting the high-low-2 values of candles and simulates something that is similar to a Volume Profile without using any Volume data.
Core facts:
Creates a pseudo Volume Profile by counting values of candles and sorting them into a Profile.
Works for charts that don't provide any Volume Information.
Can display up to 5 different Value Levels.
Value level colors are (from largest to smallest level): Red, Orange, Yellow, Green, Blue.
The Value levels can be used as Support and Resistance indicators.
The Custom Range of the Volume Profile can be adjusted from 10 to 1500 bars.
Much faster than the other custom pseudo VPVRs out there.
Shortcomings:
As the chart progresses with bars the line positions will distort to the left side. Refreshing the tradingview page or switching to another time interval fixes this. I might fix this issue in the future.
Does not use actual Volume nor display actual Volume.
Note: For those who wondered what happened to my first version of this indicator: It got taken down by Tradingview because it was misleading as to using the words "Volume Profile" and "Visible Range". I fully support their decision and I hope I could clear any misunderstandings! Give their team a heads up for the hard work they're doing in keeping this place clean and well organized!
Enjoy! :)

Periodic Volume Profile++ [Pt]█ Introduction
The Advanced Pro ++ Version of the Periodic Volume Profile is an advanced TradingView indicator, designed for traders focusing on volume-driven strategies. It provides detailed volume distribution and key levels over selected periods with extensive customization options.
█ Features Overview
Highly customizable and versatile, this tool is essential for a trader's toolkit, offering a variety of settings to suit specific trading needs.
█ Volume Profile
Display Modes: Four options - Off, Total, Up/Down, Gradient.
POC Highlighting: Option to highlight the Point of Control (POC) VP histogram bar.
VP Bar Size Control: Customize the number of ticks per VP bar, including a 'use min tick' option.
Volume Display: Show volume figures on the profile.
Developing VP Color Theme: Different color themes for developing VP.
█ Point of Control (POC)
Historical POCs: Display POCs from a specified number of past periods.
POC Levels: Auto-drawn levels indicating price, period, timeframe, and volume.
Color Customization: Separate color options for closest POCs, older POCs, and NPOCs (Naked POCs).
Closest Historical POC Display: Show nearest historical POC within a customizable range.
Low Volume POC Fading: Fade out low volume POC lines.
█ Value Area and Background Color
Display Options: Off, Custom Color, or Color based on Period Close vs. Open.
Customizable Colors: Tailor the color scheme as per preference.
Value Area High/Low Prices: Display options for VAH and/or VAL.
█ Extra Options
Periodic Candle Bar Display: Show candle bar for each period with customizable colors.
Previous POC, VAH, VAL Display: Display these levels in dashed lines.
The Advanced Pro ++ Volume Profile indicator is a top choice for traders seeking in-depth analysis of volume patterns and market structure, offering unparalleled customization and precision.

Uniform Volume ProfileUniform Volume Profile
The volume of a single candlestick is uniformly distributed by its range (high - low) along all the colliding volume profile bars.
For example, if a 10% of a candlestick intersects some volume bar (horizontal line) only the 10% of that candlestick volume will contribute to that profile.

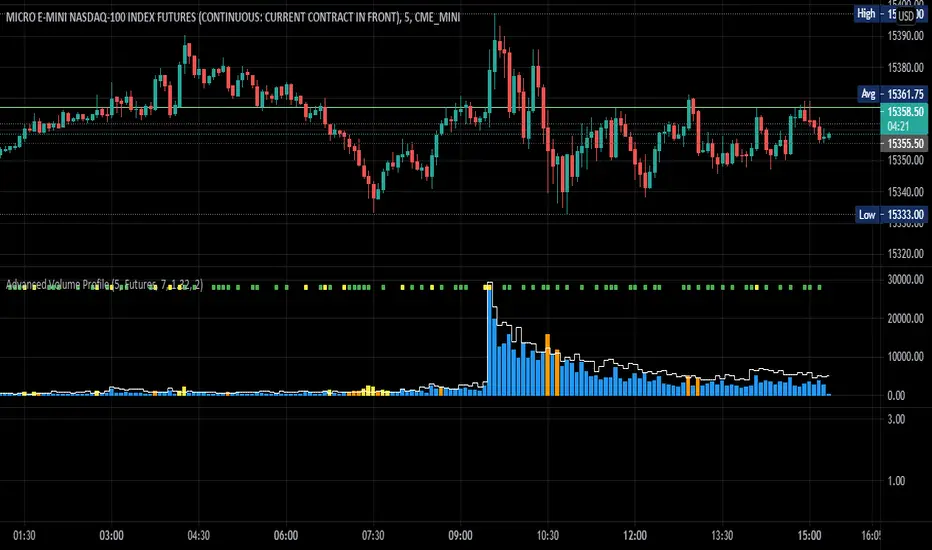
Advanced Volume ProfileTHIS SCRIPT CURRENTLY ONLY WORKS FOR ASSETS THAT TRADE 24/7 OR CBOE FUTURES HOURS!
This script plots volume relative to an asset's historical volume profile.
Usage:
As a companion to my "Unusual Time Frame Volume" (UTF Volume) script, this plots volume against the same historical volume profile used for UTF Volume.
The same high volume (relative to historical) threshold alert is available (yellow bar).
Likewise, if the volume exceeds the historical threshold, but is below the alert threshold, the bar color is orange.
At the top of the chart is an indicator which is green if a bar has higher volume than the previous bar.
You can also set a threshold for this such that if the volume of a bar exceeds the previous bar by a certain multiplier which will turn the indicator yellow.
For example, if the threshold is set to "1.5", then the indicator will be yellow (instead of green) on an increase in volume over the previous bar of 1.5x.
NOTES:
Again, this script currently only works for assets that trade 24/7 or CBOE Futures hours!
Make sure you set the "Asset Mode" and "Time Frame (minutes)" to values that match your asset and chart setting.
For example, if you are trading Futures on a 2m chart, set the Asset Mode to Futures and Time Frame to 2m.
If you are trading crypto on a 5m chart, set the Asset Mode to 24/7 and Time Frame to 5m.
If the settings are not set appropriately, the output will be incorrect/invalid.
If you choose a "Look-back (Days)" setting that is too far back given the time frame, the script will produce an error.
I suggest playing with settings from "1" (compares volume to the previous day's volume) to the highest number that doesn't break the script.
For example, at a 2m time frame, the maximum look-back will be "6" or "7" depending on which mode you are using.
Longer chart time settings allow larger look-back values.
I find that the default value ("6") does a decent job in general.
Please feel free to reuse or further develop this script.
I would greatly appreciate it if you would send me a message below if you find it useful.
Continuous Volume Profile v1.0This script is a continuous real time Volume Profile. Unlike the standard Volume Profile that focuses on fixed/visible range it will update and plot the following on every bar.
Point of Control (POC)
Value Area High (VAH)
Value Area Low (VAL)
You have the standard 3 parameters to configure:
Period Length
Number of Bins/Rows
Percent for Value Area
Please pm me if you would like to try the script.

Zeta Volume Profile ProWhat is Volume Profile?
Volume Profile is an advanced order flow analysis which displays volume distribution at various price points over time. It may be called a recent biodata of a stock which is displayed on a chart as a horizontal histogram. Volume Profile can help reveal significant price levels where smart money is sitting.
Why Volume Profile is important?
The life of a Future Contract is of maximum 3 months. All the near month contracts expire on the last Thursday of the respective month. But, the traders who want to continue holding on to their winning positions would likely take the same position in the next series. So they often close the existing position near the expiry and take position in the next series. This activity is termed as Rolling Over the position and mostly it catches strength about 5-6 days before the expiry.
If we start tracking Volume Profile 5-6 days before the monthly expiry, we get to know the levels where maximum concentration of volume is located. In layman terms, we want to see where the biggest crowd is sitting. In this crowd, there will be equal number of buyers and sellers and when either party starts feeling the heat (market goes against them), they try to limit their loss by Buying/Selling and the random walks become a unidirectional march.
Zeta Volume Profile Pro tries to detect this crowd behavior by tracking maximum volume concentration area and when price leaves this area, it generates Buy/Sell Signals.
What is unique about Zeta Volume Profile Pro?
There are other volume profile indicators also in the market but Zeta Volume Profile Pro is unique in following aspects:
1. Whenever last Thursday of any month starts, Zeta Volume Profile Pro resets automatically and starts calculating volume and price levels from 30 bars backwards (default value which the user can change). Assuming we are looking at 30 Min. Time-Frame chart and your Stock Exchange opens for 6 hours a day, the last 30 candles cover 5 days data. If in your time zone, stock exchange remains open for longer hours, you can either increase minimum number of bars to be considered or you may increase your time-frame. The idea is you should cover 5-6 days of data on last Thursday of the month.
2. Once you set the minimum number of bars and time-frame relevant to you, leave everything to Zeta Volume Profile Pro. Now with every passing tick, the volume profile created by Zeta Volume Profile Pro will keep changing and more and more price bars will keep adding to the minimum number of bars set by you till last Wednesday of the current month occurs.
3. On any given day or time, whenever price breaks out of maximum volume concentration area, the indicator generates a Buy/Sell Signal and often such breakouts give handsome returns.
What markets it is suitable for?
It can be used in any time-zone on any stock exchange. However, since the concept is based upon Volume Concentration, it works best on highly liquid stocks, commodities, currency pairs and indices.
It will not give good results if the underlying security is illiquid because volume profile generated will not be efficient one.
Since Future Contracts volume tends to be more than cash segment, it gives much better results on Futures Charts.
Which time frames are best for this indicator?
Choose such time-frame and minimum number of bars which are equivalent to 5-6 trading sessions in your time-zone. In settings, there is an option to set your time-zone.
How to Take Buy/Sell Entry with Zeta Volume Profile Pro?
Whenever you see a Buy Signal appearing on your chart, take Buy Entry and whenever you see a Sell Signal, take Sell side Entry.
Your STOP LOSS would be high or low of candle which occurs just before the Buy/Sell Signal respectively.
Keep moving your STOP LOSS up as the price moves in your favor and when market turns around and you see a SELL signal, it is time to book your BUY position profit and take Entry on SELL Side now and so on.
What are the limitations of this indicator?
Sometimes price takes a break out of maximum volume concentration area and then again comes back which might hit your stop loss. However, as the backtested data shows, having faith in the indicator will give you some so nice breakouts that a single trade will cover your 10 to 20 Stop Loss hits.
How to get this indicator?
This is invite-only indicator. Get in touch with us using information given below in Signature field to try this tool FREE for 02 live sessions. After that, it is subscription based access.

Options Volume ProfileOptions Volume Profile
Introduction
Unlock institutional-level options analysis directly on your charts with Options Volume Profile - a powerful tool designed to visualize and analyze options market activity with precision and clarity. This indicator bridges the gap between technical price action and options flow, giving you a comprehensive view of market sentiment through the lens of options activity.
What Is Options Volume Profile?
Options Volume Profile is an advanced indicator that analyzes call and put option volumes across multiple strikes for any symbol and expiration date available on TradingView. It provides a real-time visual representation of where money is flowing in the options market, helping identify potential support/resistance levels, market sentiment, and possible price targets.
Key Features
Comprehensive Options Data Visualization
Dynamic strike-by-strike volume profile displayed directly on your chart
Real-time tracking of call and put volumes with custom visual styling
Clear display of important value areas including POC (Point of Control)
Value Area High/Low visualization with customizable line styles and colors
BK Daily Range Identification
Secondary lines marking significant volume thresholds
Visual identification of key strike prices with substantial options activity
Value Area Cloud Visualization
Configurable cloud overlays for value areas
Enhanced visual identification of high-volume price zones
Detailed Summary Table
Complete breakdown of call and put volumes per strike
Percentage analysis of call vs put activity for sentiment analysis
Color-coded volume data for instant pattern recognition
Price data for both calls and puts at each strike
Custom Strike Selection
Configure strikes above and below ATM (At The Money)
Flexible strike spacing and rounding options
Custom base symbol support for various options markets
Use Cases
1. Identifying Key Support & Resistance
Visualize where major options activity is concentrated to spot potential support and resistance zones. The POC and Value Area lines often act as magnets for price.
2. Analyzing Market Sentiment
Compare call versus put volume distribution to gauge directional bias. Heavy call volume suggests bullish sentiment, while heavy put volume indicates bearish positioning.
3. Planning Around Institutional Activity
Volume profile analysis reveals where professional traders are positioning themselves, allowing you to align with or trade against smart money.
4. Setting Precise Targets
Use the POC and Value Area High/Low lines as potential profit targets when planning your trades.
5. Spotting Unusual Options Activity
The color-coded volume table instantly highlights anomalies in options flow that may signal upcoming price movements.
Customization Options
The indicator offers extensive customization capabilities:
Symbol & Data Settings : Configure base symbol and data aggregation
Strike Selection : Define number of strikes above/below ATM
Expiration Date Settings : Set specific expiry dates for analysis
Strike Configuration : Customize strike spacing and rounding
Profile Visualization : Adjust offset, width, opacity, and height
Labels & Line Styles : Fully configurable text and visual elements
Value Area Settings : Customize POC and Value Area visualization
Secondary Line Settings : Configure the BK Daily Range appearance
Cloud Visualization : Add colored overlays for enhanced visibility
How to Use
Apply the indicator to your chart
Configure the expiration date to match your trading timeframe
Adjust strike selection and spacing to match your instrument
Use the volume profile and summary table to identify key levels
Trade with confidence knowing where the real money is positioned
Perfect for options traders, futures traders, and anyone who wants to incorporate institutional-level options analysis into their trading strategy.
Take your trading to the next level with Options Volume Profile - where price meets institutional positioning.

Dynamic Volume Profile Oscillator | AlphaAlgosDynamic Volume Profile Oscillator | AlphaAlgos
Overview
The Dynamic Volume Profile Oscillator is an advanced technical analysis tool that transforms traditional volume analysis into a responsive oscillator. By creating a dynamic volume profile and measuring price deviation from volume-weighted equilibrium levels, this indicator provides traders with powerful insights into market momentum and potential reversals.
Key Features
• Volume-weighted price deviation analysis
• Adaptive midline that adjusts to changing market conditions
• Beautiful gradient visualization with 10-level intensity zones
• Fast and slow signal lines for trend confirmation
• Mean reversion mode that identifies price extremes relative to volume
• Fully customizable sensitivity and smoothing parameters
Technical Components
1. Volume Profile Analysis
The indicator builds a dynamic volume profile by:
• Collecting recent price and volume data within a specified lookback period
• Calculating a volume-weighted mean price (similar to VWAP)
• Measuring how far current price has deviated from this weighted average
• Adjusting this deviation based on historical volatility
2. Oscillator Calculation
The oscillator offers two calculation methods:
• Mean Reversion Mode (default): Measures deviation from volume-weighted mean price, normalized to reflect potential overbought/oversold conditions
• Standard Mode : Normalizes volume activity to identify unusual volume patterns
3. Adaptive Zones
The indicator features dynamic zones that:
• Center around an adaptive midline that reflects the average oscillator value
• Expand and contract based on recent volatility (standard deviation)
• Visually represent intensity through multi-level gradient coloring
• Provide clear visualization of bullish/bearish extremes
4. Signal Generation
Trading signals are generated through:
• Main oscillator line position relative to the adaptive midline
• Crossovers between fast (5-period) and slow (15-period) signal lines
• Color changes that instantly identify trend direction
• Distance from the midline indicating trend strength
Configuration Options
Volume Analysis Settings:
• Price Source - Select which price data to analyze
• Volume Source - Define volume data source
• Lookback Period - Number of bars for main calculations
• Profile Calculation Periods - Frequency of profile recalculation
Oscillator Settings:
• Smoothing Length - Controls oscillator smoothness
• Sensitivity - Adjusts responsiveness to price/volume changes
• Mean Reversion Mode - Toggles calculation methodology
Threshold Settings:
• Adaptive Midline - Uses dynamic midline based on historical values
• Midline Period - Lookback period for midline calculation
• Zone Width Multiplier - Controls width of bullish/bearish zones
Display Settings:
• Color Bars - Option to color price bars based on trend direction
Trading Strategies
Trend Following:
• Enter long positions when the oscillator crosses above the adaptive midline
• Enter short positions when the oscillator crosses below the adaptive midline
• Use signal line crossovers for entry timing
• Monitor gradient intensity to gauge trend strength
Mean Reversion Trading:
• Look for oscillator extremes shown by intense gradient colors
• Prepare for potential reversals when the oscillator reaches upper/lower zones
• Use divergences between price and oscillator for confirmation
• Consider scaling positions based on gradient intensity
Volume Analysis:
• Use Standard Mode to identify unusual volume patterns
• Confirm breakouts when accompanied by strong oscillator readings
• Watch for divergences between price and volume-based readings
• Use extended periods in extreme zones as trend confirmation
Best Practices
• Adjust sensitivity based on the asset's typical volatility
• Use longer smoothing for swing trading, shorter for day trading
• Combine with support/resistance levels for optimal entry/exit points
• Consider multiple timeframe analysis for comprehensive market view
• Test different profile calculation periods to match your trading style
This indicator is provided for informational purposes only. Always use proper risk management when trading based on any technical indicator. Not financial advise.

Enhanced Volume Profile█ OVERVIEW
The Enhanced Volume Profile (EVP) is an indicator designed to plot a volume profile on the chart based on either the visible chart range or a fixed lookback period. The script helps analyze the distribution of volume at different price levels over time, providing insights into areas of high trading activity and potential support/resistance zones.
█ KEY FEATURES
1. Visible Chart Range vs. Fixed Lookback Depth
Visible Chart Range
- Default analysis mode
- Calculates profile based on visible portion of the chart
- Dynamically updates with chart view changes
Fixed Lookback Depth
- Optional alternative to visible range
- Uses specified number of bars (10-3000)
- Provides consistent analysis depth
- Independent of chart view
2. Custom Resolution
Auto-Resolution Mode
Automatically selects timeframes based on chart's current timeframe:
≤ 1 minute: Uses 1-minute resolution
≤ 5 minutes: Uses 1-minute resolution
≤ 15 minutes: Uses 5-minute resolution
≤ 1 hour: Uses 5-minute resolution
≤ 4 hours: Uses 15-minute resolution
≤ 12 hours: Uses 15-minute resolution
≤ 1 day: Uses 1-hour resolution
≤ 3 days: Uses 2-hours resolution
≤ 1 week: Uses 4-hours resolution
Custom Resolution Override
Optional override of auto-resolution system
Provides control over data granularity
Must be lower than or equal to chart's timeframe
Falls back to auto-resolution if validation fails
3. Volume Profile Resolution
Adjustable number of points (10-400)
Controls profile granularity
Higher resolution provides more detail
Balance between precision and performance
4. Point of Control (PoC)
Identifies price level with highest traded volume
Optional display with customizable appearance
Adjustable line thickness (1-30)
Configurable color
5. Value Area (VA)
Shows price range of majority trading volume
Adjustable coverage (5-95%), default is 68%
Customizable boundary lines
Configurable lines color and thickness (1-20)
█ INPUT PARAMETERS
Lookback Settings
Use Visible Chart Range
- Default: true
- Calculates profile based on visible bars
- Ideal for focused analysis
Fixed Lookback Bars
- Range: 10-3000
- Default: 200
- Used when visible range is disabled
Resolution Settings
Enable Custom Resolution
- Default: false
- Overrides auto-resolution
Custom Resolution
- Default: 1-minute
- Changes automatically when "Enable Custom Resolution" is disabled
Volume Profile Appearance
Profile Resolution
- Range: 10-400
- Default: 200
- Controls detail level
Profile Width Scale
- Range: 1-50
- Default: 15
- Adjusts profile width
Right Offset
- Range: 0-500
- Default: 20
- Controls spacing from price bars
Profile Fill Color
- Default: #5D606B (70% transparency)
Point of Control Settings
Show Point of Control
- Default: true
- Toggles PoC visibility
PoC Line Thickness
- Range: 1-30
- Default: 1
PoC Line Color
- Default: Red
Value Area Settings
Show Value Area
- Default: true
- Toggles VA lines
Value Area Coverage
- Range: 5-95%
- Default: 68%
Value Area Line Color
- Default: Blue
Value Area Line Thickness
- Range: 1-20
- Default: 1
█ TECHNICAL IMPLEMENTATION DETAILS
Exceeding Bars Management
The script dynamically adjusts the number of bars used in the volume profile calculation based on the selected timeframe and the maximum allowed bars (max_bars_back).
If the total number of bars exceeds the predefined threshold (6000 bars), the script reduces the lookback period (lookback_bars) by trimming some of the historical data, ensuring the chart does not become overloaded with data.
The adjustment is made based on the ratio of bars per candle (bars_per_candle), ensuring that the volume profile remains computationally efficient while maintaining its relevance.
█ EXAMPLE USE CASES
1. Visible Range Mode
For analyzing a recent trend and focusing on only the visible part of the chart, enabling the "Use Visible Chart Range" option calculates the profile based on the current view, without considering historical data outside the visible area.
2. Fixed Lookback Depth
For analyzing a specific period in the past (e.g., the last 200 bars), disabling the visible range and setting a fixed lookback depth of 200 bars ensures the profile always considers the last 200 bars, regardless of the visible range.
3. Custom Resolution
If there’s a need for greater control over the timeframe used for volume profile calculations (e.g., using a 5-minute resolution on a 15-minute chart), enabling custom resolution and setting the desired timeframe provides this control.
HAPPY TRADING ✌️

Volume Analysis - Heatmap and Volume ProfileHello All!
I have a new toy for you! Volume Analysis - Heatmap and Volume Profile . Honestly I started to work to develop Volume Heatmap then I decided to improve it and add more features such Volume profile, volume, difference in Buy/Sell volumes etc. I tried to put my abilities into this script and tried to use some new Pine Language™ features ( method, force_overlay, enum etc features ). I hope the usage of these new features would be an example for Pine Programmers.
Lets talk about how it works:
- It gets number of Rows/Columns from the user for each candle to create heatmap
- It calculates the number of the candles to analyze. Number of the candles may change by number of Rows/columns or if any volume / difference in volumes / volume profile is enabled
- It gets Closing/Opening price, Volume and Time info from lower time frame for each candle ( it can be up to 100K for each candle )
- After getting the data it calculates lower time frame to analyze
- Then it calculates how closing price moves, how much volume on each move and create boxes by the volume/move in each box
- The colors for each box calculated by volume info and closing price movements in the lower time frame
- It shows the boxes on Absolute places or Zero Line optionally
- it shows Volume, Cumulative volume, Difference between Buy/Sell volume for each column
- it changes empty box color by Chart background color, also you can change transparency
- At this time it creates Volume Profile with up to 25 rows
- As a new Pine Language™ feature, it can show Volume Profile in the indicator window or in Main chart, shows Value Area, Value Area High (VAH), Value Area Low (VAL), and draw it and POC (Point Of Control) in the indicator window and/or in the main chart
- Honestly the feature I like is that: For the markets that are not open 24/7, it combines the data from the lower time period without any gaps. For example, if you work for a market that is closed on Saturdays and Sundays, it ensures data integrity by omitting weekends and holidays. so for example if the data is like "ABC---DEF-X---YL-Z" then it makes this data like "ABCDEFXYLZ". In this way, there will be no data breaks in the displayed boxes, there will be no empty colons, and it will appear as if data is coming in at any time.
- Finally it shows Info Panel to give info, its background color automatically changes by the Chart background color
- Important! You should set your "Plan" accordingly, your plan is "Premium or Higher" or "Lower tier". so the script can understand the minimum time frame it can get data!!
I tried to share many screenshots below to explain it much better
How it looks?
it shows Highest Buy/Sell volumes brighter, move volume -> brighter
Volume Profile ( up to 25 row s) ( number of contained candles should be more than 1 )
Volume Profile can be shown in the main chart optionally
How the main chart looks:
Closing price shown and you can enable it, change colors & line width
Can include many candles according to Row&Column number you set
Optionally it can show cumulative volume for each candle
Closing prices from lower time frame
Shows Candle Body by changing background colors
It can shows all included candles on Zero line
You can change the colors of many things
You can set Empty box and border transparency
Table, Empty box Colors adjustment done automatically by chart background color
Sometimes we can not get data from some historical candles if time frame is high such 2days, 1 week etc, and it looks like:
It also checks if Chart time frame and Chart type is suitable
Enjoy!

Fixed volume profile & zonesHi all!
If you like volume profile and like to create zones, where the price might react, this indicator might be for you. It plots a fixed volume profile and creates a user defined number of zones (shelves) of high volume.
If you want to know more about volume profile you can about it here on TradingView: se.tradingview.com
To do
• Add possiblity to create alerts for zone entries, breakouts and retest
• The importance of zones are now based on high volume slots only. It might be changed to include the slots around the 'master slot' to determine if the area is of high importance or not, your suggestions here are welcome!
• Show total volume in 'values'
• Error if the data cannot be fetched
• Add value area
• Make earlier (more important shelves) more visible (less transparent)
• Add possiblity to skip zones
Known issues
• Script execution is long when the volume profile is created (should be none)
• In some cases you can get overlapping shelves, avoid this
Settings
• Main
• Start/end bar of the volume profile (this is required)
• Data
• Timeframe (for getting the volume data)
• Levels (the number of slots in the volume profile)
• Shelves (the number of zones with high volume to plot) and it's color
• Max slot (have this enabled if you want the shelf's highest volume slot to have a dotted line and choose it's color
• Show info (show the order of the plotted zone)
• Style (how the volume profile will look)
• Histogram box (the color of the background of the volume profile)
• Up (the color of bullish volume)
• Down (the color of bearish volume)
• Point of control (color and if it should be extended or not)
• Values and text color (show bullish and bearish volume values)
The defaults on all settings are based on the daily timeframe. This indicator is not 'complete' and I plan to work on it when I get the time.
Note that the precision for the volume profile is per candle, so some levels can have visuals as others but lower volume.
The slot (level) volume has to have a lower difference to the volume included in the shelf than the next volume to be checked to be included. If the level being checked for inclusion in a shelf is at the end of boundaries (high and low) of the volume profile, the volume has to be higher than the golden ratio of the volume before.
You can also use this indicator if you just want a volume profile to show, just set the the number of zones to plot (in 'Shelves') to 0.
I hope I haven't forgotten anything and that it's clear, let me know otherwise.
Best of trading luck!

Periodic Volume Profile+ [Pt]This is a + version of my original Periodic Volume Profile indicator
This script includes the following extra unique features.
Show last X number of POC levels
- automatically draws these POC lines
- labels are shown as
- Naked POCs are labelled as NPOC
- label position and text size can be adjusted
Profile Range and Value Area background colors
- Option to color background based on periodic open/close price
Option to show Value Area High (VAH) and Value Area Low (VAL) Prices
What is Volume Profile?
Volume profile is a technical analysis tool that shows the volume of trades at different prices for a given security or market over a specific period of time.
How to effectively use it?
Identify key levels of support and resistance: The Periodic Volume Profile indicator can be used to identify key levels of support and resistance based on the volume of trades at different price levels. High volume areas can indicate strong support or resistance levels, while low volume areas can indicate areas of weakness or potential breakouts.
Assess overall supply and demand: The Periodic Volume Profile indicator can help traders assess overall supply and demand for a security. If there is high volume at a particular price level, this can indicate a high level of demand, while low volume can indicate low demand.
Use it in conjunction with other indicators: The Periodic Volume Profile indicator is best used in conjunction with other technical analysis tools. For example, you can use it with moving averages, trend lines, or other indicators to confirm signals or identify potential entry and exit points.
Consider the overall market context: It's important to consider the overall market context when interpreting volume profile data. For example, a high volume area may not necessarily indicate a strong level of support or resistance if the overall market is in a downtrend.
Monitor changes over time: Keep an eye on how the volume profile changes over time. If there are significant changes in the volume of trades at certain price levels, this could indicate a shift in market sentiment or a change in the underlying fundamentals of the security.